UNITED STATES
SECURITIES AND EXCHANGE COMMISSION
WASHINGTON, D.C. 20549
FORM 8-K
CURRENT REPORT
Pursuant to Section 13 or 15(d) of the Securities Exchange Act of 1934
Date of Report (Date of earliest event reported): May 5, 2025
(Exact name of registrant as specified in charter)
| (State or other jurisdiction of incorporation) | (Commission File Number) | (IRS Employer Identification No.) | ||||||
| (Address of principal executive offices) | (Zip Code) | ||||||||||
Registrant's telephone number, including area code: (212 ) 524-8791
(Former name or former address, if changed since last report)
Check the appropriate box below if the Form 8-K filing is intended to simultaneously satisfy the filing obligation of the registrant under any of the following provisions:
| Securities registered pursuant to Section 12(b) of the Act: | ||||||||||||||
| Title of each class | Trading Symbol | Name of exchange on which registered | ||||||||||||
(Nasdaq Global Select Market) | ||||||||||||||
Indicate by check mark whether the registrant is an emerging growth company as defined in Rule 405 of the Securities Act of 1933 (§230.405 of this chapter) or Rule 12b-2 of the Securities Exchange Act of 1934 (§240.12b-2 of this chapter).
Emerging growth company ☐
If an emerging growth company, indicate by check mark if the registrant has elected not to use the extended transition period for complying with any new or revised financial accounting standards provided pursuant to Section 13(a) of the Exchange Act. ☐
ITEM 2.02 Results of Operations and Financial Condition
On May 5, 2025, Vimeo, Inc. (the “Company”) issued a shareholder letter (the "Letter") announcing the Company's results for the fiscal quarter ended March 31, 2025. The full text of the Letter, which is posted on the Company’s website at https://vimeo.com/investors/ and appears in Exhibit 99.1 hereto, is incorporated herein by reference. In the Letter, the Company also announced that it would be livestreaming a video conference on May 5, 2025, at 5:00 p.m. Eastern Time to answer questions regarding its first quarter results.
The Letter includes certain non-GAAP financial measures. Reconciliations of these non-GAAP financial measures to the comparable GAAP financial measures are contained in the Letter and the financial tables attached thereto.
The information furnished under this Item 2.02 and in the accompanying Exhibit 99.1 shall not be deemed “filed” for purposes of Section 18 of the Securities Exchange Act of 1934, as amended (the “Exchange Act”), or incorporated by reference in any filing under the Securities Act of 1933, as amended, or the Exchange Act regardless of any general incorporation language in such filing, unless expressly incorporated by specific reference in such filing.
ITEM 8.01 Other Events.
On April 29, 2025, the Board of Directors of the Company authorized a new stock repurchase program of up to $50 million of the Company’s common stock (the “2025 Repurchase Program”). Under the 2025 Repurchase Program, the Company’s shares of common stock may be repurchased at any time or from time to time, without prior notice, subject to market conditions and other considerations. Such repurchases may be made through 10b5-1 plans, open market purchases, privately negotiated transactions, block purchases or other transactions. The Company has no obligation to repurchase any shares under the 2025 Repurchase Program. The 2025 Repurchase Program does not have an expiration date and may be commenced, suspended, revoked or modified at any time.
ITEM 9.01 Financial Statements and Exhibits.
| Exhibit No. | Description | |||||||
Shareholder Letter of Vimeo, Inc. dated May 5, 2025 | ||||||||
| 104 | Cover Page Interactive Data File (embedded within the Inline XBRL document) | |||||||
2
SIGNATURES
Pursuant to the requirements of the Securities Exchange Act of 1934, the Registrant has duly caused this report to be signed on its behalf by the undersigned hereunto duly authorized.
| VIMEO, INC. | |||||||||||
| By: | /s/ Gillian Munson | ||||||||||
| Name: | Gillian Munson | ||||||||||
| Title: | Chief Financial Officer (Principal Financial Officer) | ||||||||||
Date: May 5, 2025
3
Exhibit 99.1

| Dear Shareholders, |  Philip Moyer, CEO . | |||||||
I’ve been at Vimeo for one year and 2025 is off to a strong start. We are one of the largest, and most trusted, private video networks in the world. We serve millions of customers for three simple use cases: marketers reaching their customers, businesses educating their teams, and content creators engaging their audiences. In 2025, we have goals to grow our customer base, expand the value we provide them, and accelerate our pace of innovation. While there is macroeconomic uncertainty that could impact customer purchases, we believe that by delivering on these goals, we can grow revenue and generate Free Cash Flow* and emerge as a trusted partner for ever more customers.
In Q1, Self-Serve delivered growth for the first time in three years, with a 6% year-over-year increase in quarterly bookings. We also expanded ARPU by 8% and achieved our highest dollar retention rate since Q3'21. Vimeo Enterprise experienced 32% revenue growth, 16% ARPU growth, and an 11% increase in customers. Product innovation accelerated with over 30 releases. Despite negative Free Cash Flow* due to bonus payouts and increased planned investments, we achieved our third consecutive quarter of year-over-year bookings growth with Adjusted EBITDA* profitability. We repurchased $24 million of stock to minimize dilution, and on April 29, 2025, our Board authorized a new repurchase program, which is described below.
Each of these milestones this quarter demonstrate why we are excited about our future and believe that Vimeo can accelerate profitable revenue.
Q1 2025 Highlights:
–Self-Serve bookings re-acceleration. In Q1, Self-Serve bookings grew by 6% and was 54% of our revenue. We continued to benefit from price increases being rolled out across our customer base. These price increases should continue to aid bookings growth through 2025. In Q4’24 we announced new leadership for Self-Serve. The customer centricity and innovation roadmap from this new team is inspirational and we continue to believe that we can return to subscriber growth in Self-Serve and build positive bookings and revenue velocity.
–Vimeo Enterprise double-digit momentum. Vimeo Enterprise revenue grew 32% and was 24% of our revenue. In Q1 we announced new leadership for our Sales-Led operations and made important structural changes in our go-to-market teams to scale our enterprise sales motions, globally. Our bookings grew by 13% and we saw year-over-year increases in our top of funnel pipeline, ARPU, and customer counts while maintaining stable retention. We continue to have one of the largest enterprise video businesses in the world with some of the largest customers in the world. This quarter we welcomed FIFA, Fortuna Games, Christus Health, Veracyte, and Tubi to our platform and renewed our contracts with Qualtrics, Green Bay Packers, and London Stock Exchange.
–Investing for growth. Our markets are growing and we are seeing a clear correlation between innovation, retention and growth. During the quarter, we increased R&D spend by 11% on a GAAP and 14% on a non-GAAP* basis year-over-year, and our pace of product releases accelerated. Additionally, over the past year we moved the majority of our business to a new, more modern billing and payments infrastructure which we believe will enable us to serve customers more efficiently and gives us the flexibility to expand ARPU beyond our core subscriptions.
We also recently introduced new AI tools to all Self-Serve subscribers, including AI captions and translations. With around 45% of our customers located outside the US, these new multilingual services enable our customers to seamlessly cater to global audiences. Additionally, we launched our new Vimeo Streaming product and implemented significant enhancements to Vimeo Central, improving discoverability, security, and monetization for creators. These developments have garnered attention, with over 120 articles published about Vimeo since January 1, 2025 – our highest quarterly article count in over 3 years.
Over the past year we have built a new leadership team, increased our pace of innovation, streamlined execution, released market-leading innovations, consolidated product offerings, grew our customer centricity, built essential infrastructure to scale, and returned the company to bookings growth. In 2025, we are investing up to $30 million, primarily in R&D, so that we can continue to accelerate growth in future years. The product launches we discussed above are part of these investments, and we are increasingly confident that our investments are working.
*Please refer to the reconciliations of GAAP to non-GAAP measures starting on page 18.
2
As we look at the year ahead, the global economic environment will likely require vigilance and could create additional risks or impact customer acquisition, revenue and ARPU. But our 2025 goal of accelerating our growth is unchanged and we continue to hope to end the year with a line of sight to double-digit growth.
Thank you for your continued support and belief in Vimeo. We're excited about the future and look forward to sharing our progress with you.
Sincerely,

Philip Moyer
Chief Executive Officer
*Please refer to the reconciliations of GAAP to non-GAAP measures starting on page 18.
3
Q1 Financial
Overview


Disclosure Update
Vimeo's operational changes have, and will likely continue to lead to adjustments in its disclosure framework, including the disaggregation of certain data and key operating metrics. For Q1 earnings, our revenue and associated metrics have been disaggregated into different categories, resulting in the separate disclosure of Add-Ons (previously reported with Self-Serve) and OTT (previously reported in Other). Further reporting adjustments may be considered to align our disclosure to our core operating processes as they evolve, including changes involving merging OTT and Vimeo Enterprise operations, introducing consumption based revenue related to AI, and focusing sales on revenue metrics. We appreciate your understanding as we endeavor to properly align our disclosure to our core operating processes.
*Please refer to the reconciliations of GAAP to non-GAAP measures starting on page 18.
4
Total Bookings & Revenue

| Bookings year-over-year Change | ||||||||||||||
| —% | (4)% | —% | 3% | 3% | ||||||||||
| Revenue year-over-year Change | ||||||||||||||
| 1% | 2% | (2)% | (2)% | (2)% | ||||||||||
*Please refer to the reconciliations of GAAP to non-GAAP measures starting on page 18.
5
Vimeo
Enterprise
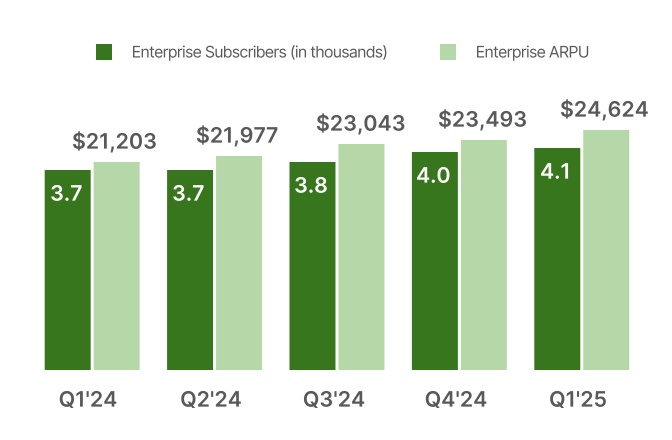
In Q1, Vimeo Enterprise revenue grew 32% and bookings grew 13%, with an 11% increase in Subscribers and ARPU of $24,624, up 16% year-over-year. Top of the funnel growth accelerated in Q1 compared to both Q4’24 and Q1’24 and we saw stability across both dollar and unit retention. Our bookings growth decelerated in the quarter, as we had a tough comparable to the prior year’s growth rate of 47% and we enacted major transitions in our sales team during the quarter.
During the quarter, we launched key features to enhance enterprise readiness and global scalability including:
•LMS integrations: Enabling learner engagement tracking within existing learning management systems.
•Custom subdomains: Allowing enterprise clients to host Vimeo under custom domains.
•EU data residency options: Expanding GDPR and sovereignty compliance in Germany and Belgium.
•Federated search APIs: Making Vimeo-hosted videos discoverable within enterprise knowledge systems.
•Alibaba content moderation integration in China: Ensuring compliance with local regulations.
In Q1, our new CRO made changes to our sales team, transitioning to a new structure, consolidating leadership and combining OTT sales and support teams while upleveling across the board.
In early Q2, we launched Vimeo Streaming, an enterprise-grade offering for live and on-demand distribution. Vimeo Streaming combines playback, AI insights, and LMS integrations for training, education, and content businesses, expanding Vimeo's market reach. While Vimeo Streaming is a Vimeo Enterprise product today, over time we expect to merge OTT and Vimeo Enterprise Streaming, at which time it may ultimately be reported as a single product.

| Bookings year-over-year Change | Subscribers year-over-year Change | |||||||||||||||||||||||||||||||
| 47% | 29% | 39% | 39% | 13% | 47% | 33% | 26% | 19% | 11% | |||||||||||||||||||||||
| Revenue year-over-year Change | ARPU year-over-year Change | |||||||||||||||||||||||||||||||
| 60% | 55% | 42% | 37% | 32% | 7% | 12% | 11% | 12% | 16% | |||||||||||||||||||||||

*Please refer to the reconciliations of GAAP to non-GAAP measures starting on page 18.
6
Self-Serve
Q1 marked a turning point with a 6% year-over-year increase in bookings, our first bookings growth quarter since Q1‘22. This momentum is largely attributed to successful price increases for Plus and Pro users. ARPU grew 8% year-over-year, and bookings retention rates increased quarter-over-quarter and year-over-year while unit retention rates remained flat. We see continued opportunities as we implement the new pricing strategy across additional Self-Serve plans and we continue to see our longer term goal of growing Self-Serve subscribers as achievable.
We are particularly excited about the AI-driven video translation feature we launched in early Q2. Powered by our new AI credit system, this feature will enable subscribers to translate videos into numerous languages with a flexible, consumption-based payment structure. In Q2, we will continue to enhance the core product experience including through:
•Code-free, customizable video landing pages: To improve video distribution.
•Enhanced video review and collaboration tools: To streamline workflows for professional users and teams.
•Product-led growth best practices: Applied to all user flows, with a focus on new user engagement.
These investments aim to drive free-to-paid upgrades, grow subscribers, expand platform utility, increase user engagement, and foster long-term customer loyalty.


| Bookings year-over-year Change | Subscribers year-over-year Change | |||||||||||||||||||||||||||||||
| (5)% | (7)% | (5)% | (4)% | 6% | (9)% | (9)% | (9)% | (11)% | (11)% | |||||||||||||||||||||||
| Revenue year-over-year Change | ARPU year-over-year Change | |||||||||||||||||||||||||||||||
| (4)% | (4)% | (4)% | (7)% | (5)% | 4% | 5% | 6% | 4% | 8% | |||||||||||||||||||||||
*Please refer to the reconciliations of GAAP to non-GAAP measures starting on page 18.
7
OTT
In Q1, our OTT team executed a transition, integrating its sales and product efforts with Vimeo Enterprise. While currently offered as a standalone product, OTT is strategically positioned to become an integral part of Vimeo Streaming. We are optimistic about OTT's growth potential as evidenced by new customers such as DogTV and Trailer Park Boys. Additionally, Q1 trends for OTT included a substantial increase in pipeline, subscribers, average order value on new deals, and bookings renewal rates year-over-year.


| Bookings year-over-year Change | Subscribers year-over-year Change | |||||||||||||||||||||||||||||||
| 8% | (3)% | (3)% | 6% | (5)% | 5% | (1)% | 5% | 4% | 4% | |||||||||||||||||||||||
| Revenue year-over-year Change | ARPU year-over-year Change | |||||||||||||||||||||||||||||||
| (9)% | (1)% | (13)% | (8)% | (6)% | (14)% | (4)% | (14)% | (12)% | (9)% | |||||||||||||||||||||||
*Please refer to the reconciliations of GAAP to non-GAAP measures starting on page 18.
8
Add-Ons & Other
Q1 Add-On revenue declined year-over-year and faced headwinds from slowing new subscriber additions. However, our recently released AI translations offering and accompanying AI credit system represent the beginning of what we believe can be a significant strategic transition for Add-Ons to a consumption-based revenue stream.
Q1 Other revenue declined year-over-year, largely due to product deprecations.


| Year-over-year Change | Year-over-year Change | |||||||||||||||||||||||||||||||
| 7% | 5% | (17)% | (17)% | (21)% | (43)% | (41)% | (46)% | (41)% | (52)% | |||||||||||||||||||||||
*Please refer to the reconciliations of GAAP to non-GAAP measures starting on page 18.
9
Expenses & Profitability
We are ramping our investment in growth and innovation. In 2025, our intention is to invest up to $30 million incrementally from 2024 levels, largely in R&D growth initiatives. Our key areas of investment include AI, solutions, enterprise security and innovative video formats. Examples of areas where we are deploying growth capital strategically are AI-driven translations and video search, OTT and Vimeo Enterprise unification for content customers, and fundamental upgrades to operational efficiency and velocity such as data and payments optimization.
In Q1, higher hosting costs drove small GAAP and non-GAAP cost of revenue* increases year-over-year. GAAP and non-GAAP gross profit margin* were both 77% in Q1, down slightly from Q4’24 and Q1’24.
In Q1, GAAP and non-GAAP operating expenses* rose roughly $6 million or 8%, and $5 million or 7%, respectively, year-over-year, led by R&D which grew $3 million or 11%, and $3 million or 14%, on a GAAP and non-GAAP* basis, respectively, due to growth initiatives. In Sales and Marketing, spending growth was in the low single digits as our team continues to optimize our spend and get more productivity out of our investments. In General and Administrative, growth in spend is largely due to new management.
Q1 GAAP operating expenses included restructuring costs of nearly $2 million for adjustments as new leaders aligned and upgraded teams. Stock-based compensation expense was up $2 million or 29% year-over-year.
In Q1 we had lower net income and Free Cash Flow*. Our net loss was $4 million, while Adjusted EBITDA* was $5 million. Cash used in operations was $2 million, while Free Cash Flow* was negative $3 million.


| Year-over-year Change | Year-over-year Change | |||||||||||||||||||||||||||||||
| (1)% | (1)% | —% | (2)% | 3% | —% | —% | —% | (1)% | 3% | |||||||||||||||||||||||
*Please refer to the reconciliations of GAAP to non-GAAP measures starting on page 18.
10


| Year-over-year Change | Year-over-year Change | |||||||||||||||||||||||||||||||
| 2% | 3% | (2)% | (2)% | (3)% | 2% | 3% | (2)% | (3)% | (3)% | |||||||||||||||||||||||
| Gross Margin | Non-GAAP Gross Margin* | |||||||||||||||||||||||||||||||
| 78% | 78% | 79% | 78% | 77% | 78% | 78% | 79% | 78% | 77% | |||||||||||||||||||||||


| Year-over-year Change | Year-over-year Change | |||||||||||||||||||||||||||||||
| (5)% | —% | (4)% | 3% | 8% | (10)% | (12)% | (7)% | 1% | 7% | |||||||||||||||||||||||


| Year-over-year Change | Year-over-year Change | |||||||||||||||||||||||||||||||
| NM | 72% | 10% | (82)% | (164)% | 276% | 225% | 25% | (19)% | (61)% | |||||||||||||||||||||||
| Net Earnings (Loss) as a % of Revenue | Adjusted EBITDA Margin* | |||||||||||||||||||||||||||||||
| 6% | 10% | 9% | 1% | (4)% | 12% | 16% | 15% | 10% | 5% | |||||||||||||||||||||||
*Please refer to the reconciliations of GAAP to non-GAAP measures starting on page 18.
11
Balance Sheet &
Cash Flow Highlights
We ended Q1 with $289 million in cash and cash equivalents, down from Q4, largely driven by the early year payout of bonuses for 2024, share repurchases of $24 million, and tax obligations related to the vesting of equity. Cash used in operations was $2 million, and Free Cash Flow* was negative $3 million.
In Q1, we repurchased 3.9 million shares of Vimeo's common stock. The Q1 activity extinguished our existing $50 million share repurchase authorization. During the course of the authorization, we repurchased an aggregate of 9.8 million shares at a weighted average price of $5.13. This volume represents an amount that exceeds all of our shares issued to settle vested equity awards since our spin-off from IAC through the end of 2024, meaningfully limiting our dilution and leading to a 3% decline in our common shares outstanding vs. Q1'24. Additionally, on April 29, 2025, our Board authorized an additional $50 million share repurchase program relating to our common stock (the “2025 Repurchase Program”). Under the 2025 Repurchase Program, our shares of common stock may be repurchased at any time or from time to time, without prior notice, subject to market conditions and other considerations. Such repurchases may be made through 10b5-1 plans, open market purchases, privately-negotiated transactions, block purchases or other transactions. We have no obligation to repurchase any shares under the 2025 Repurchase Program. The 2025 Repurchase Program does not have an expiration date and may be commenced, suspended, revoked or modified at any time.
Our shares outstanding as of the end of Q1 was 164.0 million, down from 168.8 million a year earlier.


| Year-over-year Change | Year-over-year Change | |||||||||||||||||||||||||||||||
| NM | 58% | 25% | 8% | (137)% | 41% | 55% | 26% | 8% | (149)% | |||||||||||||||||||||||
Guidance
While the current economic environment will require vigilance, we continue to strive to deliver our 2025 guidance including:
•Acceleration of growth in 2025 with full year 2025 revenue to grow in the low single digits
•Full-year 2025 Operating loss to be approximately $3 million, and
•Adjusted EBITDA* of $25 million - $30 million, reflecting our desire to invest up to $30 million incrementally in our business
We also continue to hope to end the year with line of sight to double-digit growth in future quarters.
*Please refer to the reconciliations of GAAP to non-GAAP measures starting on page 18.
12
Video Conference Call
Vimeo will live stream a video conference to answer questions regarding its first quarter results on Monday, May 5, 2025, at 5:00 p.m. Eastern Time. This live stream will include disclosure of certain information, including forward-looking information, which may be material to an investor’s understanding of Vimeo’s business. The live stream will be open to the public at https://www.vimeo.com/investors.
*Please refer to the reconciliations of GAAP to non-GAAP measures starting on page 18.
13
| GAAP FINANCIAL STATEMENTS | |||||||||||
| VIMEO, INC. CONSOLIDATED STATEMENT OF OPERATIONS | |||||||||||
| ($ in thousands except per share data) | |||||||||||
| (Unaudited) | |||||||||||
| Three Months Ended March 31, | |||||||||||
| 2025 | 2024 | ||||||||||
| Revenue | $ | 103,034 | $ | 104,910 | |||||||
| Cost of revenue (exclusive of depreciation shown separately below) | 24,054 | 23,443 | |||||||||
| Gross profit | 78,980 | 81,467 | |||||||||
| Operating expenses: | |||||||||||
| Research and development expense | 31,186 | 28,135 | |||||||||
| Sales and marketing expense | 33,358 | 32,305 | |||||||||
| General and administrative expense | 20,137 | 18,034 | |||||||||
| Depreciation | 44 | 57 | |||||||||
| Amortization of intangibles | 347 | 347 | |||||||||
| Total operating expenses | 85,072 | 78,878 | |||||||||
| Operating (loss) income | (6,092) | 2,589 | |||||||||
| Other income, net | 2,581 | 3,816 | |||||||||
| (Loss) earnings before income taxes | (3,511) | 6,405 | |||||||||
| Income tax provision | (405) | (332) | |||||||||
| Net (loss) earnings | $ | (3,916) | $ | 6,073 | |||||||
| Per share information: | |||||||||||
| Basic (loss) earnings per share | $ | (0.02) | $ | 0.04 | |||||||
| Diluted (loss) earnings per share | $ | (0.02) | $ | 0.04 | |||||||
| Weighted average shares outstanding used in the computation of net (loss) earnings per share: | |||||||||||
| Basic | 161,328 | 165,033 | |||||||||
| Diluted | 161,328 | 168,996 | |||||||||
| Stock-based compensation expense by function: | |||||||||||
| Cost of revenue | $ | 177 | $ | 147 | |||||||
| Research and development expense | 3,342 | 3,823 | |||||||||
| Sales and marketing expense | 2,327 | 1,821 | |||||||||
| General and administrative expense | 3,142 | 1,181 | |||||||||
| Total stock-based compensation expense | $ | 8,988 | $ | 6,972 | |||||||
14
| VIMEO, INC. CONSOLIDATED BALANCE SHEET | |||||||||||
| ($ in thousands) | |||||||||||
| (Unaudited) | |||||||||||
| March 31, 2025 | December 31, 2024 | ||||||||||
| ASSETS | |||||||||||
| Cash and cash equivalents | $ | 289,028 | $ | 325,276 | |||||||
| Accounts receivable, net | 23,734 | 24,648 | |||||||||
| Prepaid expenses and other current assets | 24,139 | 24,732 | |||||||||
| Total current assets | 336,901 | 374,656 | |||||||||
| Leasehold improvements and equipment, net | 554 | 456 | |||||||||
| Goodwill | 245,406 | 245,406 | |||||||||
| Intangible assets with definite lives, net | 2,989 | 1,239 | |||||||||
| Other non-current assets | 19,866 | 21,064 | |||||||||
| TOTAL ASSETS | $ | 605,716 | $ | 642,821 | |||||||
| LIABILITIES AND SHAREHOLDERS' EQUITY | |||||||||||
| LIABILITIES: | |||||||||||
| Accounts payable, trade | $ | 2,783 | $ | 4,473 | |||||||
| Deferred revenue | 164,711 | 161,923 | |||||||||
| Accrued expenses and other current liabilities | 45,131 | 56,027 | |||||||||
| Total current liabilities | 212,625 | 222,423 | |||||||||
| Other long-term liabilities | 10,557 | 11,601 | |||||||||
| Commitments and contingencies | |||||||||||
| SHAREHOLDERS' EQUITY: | |||||||||||
| Common stock | 1,644 | 1,620 | |||||||||
| Class B common stock | 94 | 94 | |||||||||
| Preferred stock | — | — | |||||||||
| Additional paid-in capital | 802,134 | 801,367 | |||||||||
| Accumulated deficit | (370,239) | (366,323) | |||||||||
| Accumulated other comprehensive loss | (826) | (1,180) | |||||||||
| Treasury stock | (50,273) | (26,781) | |||||||||
| Total shareholders' equity | 382,534 | 408,797 | |||||||||
| TOTAL LIABILITIES AND SHAREHOLDERS' EQUITY | $ | 605,716 | $ | 642,821 | |||||||
15
| VIMEO, INC. CONSOLIDATED STATEMENT OF CASH FLOWS | |||||||||||
| ($ in thousands) | |||||||||||
| (Unaudited) | |||||||||||
| Three Months Ended March 31, | |||||||||||
| 2025 | 2024 | ||||||||||
| Cash flows from operating activities: | |||||||||||
| Net (loss) earnings | $ | (3,916) | $ | 6,073 | |||||||
| Adjustments to reconcile net (loss) earnings to net cash provided by operating activities: | |||||||||||
| Stock-based compensation expense | 8,988 | 6,972 | |||||||||
| Amortization of intangibles | 347 | 347 | |||||||||
| Depreciation | 44 | 57 | |||||||||
| Provision for credit losses | 320 | (81) | |||||||||
| Non-cash lease expense | 1,045 | 1,182 | |||||||||
| Other adjustments, net | 313 | (58) | |||||||||
| Changes in assets and liabilities: | |||||||||||
| Accounts receivable | (57) | 1,758 | |||||||||
| Prepaid expenses and other assets | 2,010 | 2,145 | |||||||||
| Accounts payable and other liabilities | (14,383) | (10,383) | |||||||||
| Deferred revenue | 3,194 | (2,422) | |||||||||
| Net cash (used in) provided by operating activities | (2,095) | 5,590 | |||||||||
| Cash flows from investing activities: | |||||||||||
| Capital expenditures | (142) | (160) | |||||||||
| Capitalized internal-use software development costs | (1,972) | — | |||||||||
| Net cash used in investing activities | (2,114) | (160) | |||||||||
| Cash flows from financing activities: | |||||||||||
| Amounts related to settlement of equity awards | (8,561) | (2,205) | |||||||||
| Proceeds from exercise of stock options | 247 | 12 | |||||||||
| Purchases of treasury stock | (23,791) | — | |||||||||
| Net cash used in financing activities | (32,105) | (2,193) | |||||||||
| Total cash (used) provided | (36,314) | 3,237 | |||||||||
| Effect of exchange rate changes on cash and cash equivalents and restricted cash | 60 | (141) | |||||||||
| Net (decrease) increase in cash and cash equivalents and restricted cash | (36,254) | 3,096 | |||||||||
| Cash and cash equivalents and restricted cash at beginning of period | 325,493 | 301,436 | |||||||||
| Cash and cash equivalents and restricted cash at end of period | $ | 289,239 | $ | 304,532 | |||||||
16
| VIMEO, INC. DISAGGREGATED REVENUE AND OPERATING METRICS | |||||||||||||||||||||||||||||
| (In thousands except ARPU) | |||||||||||||||||||||||||||||
| Q1'24 | Q2'24 | Q3'24 | Q4'24 | Q1'25 | |||||||||||||||||||||||||
| Disaggregated Revenue | |||||||||||||||||||||||||||||
| Self-Serve | $ | 59,107 | $ | 58,374 | $ | 58,356 | $ | 56,296 | $ | 56,112 | |||||||||||||||||||
| Vimeo Enterprise | 18,467 | 20,051 | 21,675 | 22,998 | 24,424 | ||||||||||||||||||||||||
| OTT | 13,059 | 12,641 | 12,358 | 12,432 | 12,243 | ||||||||||||||||||||||||
| Add-Ons | 10,804 | 10,190 | 9,508 | 9,055 | 8,582 | ||||||||||||||||||||||||
| Other | 3,473 | 3,120 | 2,667 | 2,375 | 1,673 | ||||||||||||||||||||||||
| Total revenue | $ | 104,910 | $ | 104,376 | $ | 104,564 | $ | 103,156 | $ | 103,034 | |||||||||||||||||||
| Operating Metrics | |||||||||||||||||||||||||||||
| Self-Serve: | |||||||||||||||||||||||||||||
| Subscribers | 1,341.6 | 1,298.1 | 1,269.1 | 1,221.5 | 1,189.3 | ||||||||||||||||||||||||
| Average Subscribers | 1,357.1 | 1,319.8 | 1,283.6 | 1,245.3 | 1,205.4 | ||||||||||||||||||||||||
| ARPU | $ | 175 | $ | 178 | $ | 181 | $ | 180 | $ | 189 | |||||||||||||||||||
| Bookings | $ | 57,671 | $ | 58,644 | $ | 53,583 | $ | 54,709 | $ | 61,113 | |||||||||||||||||||
| Vimeo Enterprise: | |||||||||||||||||||||||||||||
| Subscribers | 3.7 | 3.7 | 3.8 | 4.0 | 4.1 | ||||||||||||||||||||||||
| Average Subscribers | 3.5 | 3.7 | 3.7 | 3.9 | 4.0 | ||||||||||||||||||||||||
| ARPU | $ | 21,203 | $ | 21,977 | $ | 23,043 | $ | 23,493 | $ | 24,624 | |||||||||||||||||||
| Bookings | $ | 19,935 | $ | 23,433 | $ | 25,092 | $ | 30,180 | $ | 22,620 | |||||||||||||||||||
| OTT: | |||||||||||||||||||||||||||||
| Subscribers | 3.0 | 2.9 | 3.1 | 3.1 | 3.2 | ||||||||||||||||||||||||
| Average Subscribers | 3.0 | 3.0 | 3.0 | 3.1 | 3.2 | ||||||||||||||||||||||||
| ARPU | $ | 17,331 | $ | 17,107 | $ | 16,363 | $ | 15,814 | $ | 15,696 | |||||||||||||||||||
| Bookings | $ | 9,593 | $ | 7,492 | $ | 11,092 | $ | 9,208 | $ | 9,066 | |||||||||||||||||||
17
RECONCILIATIONS OF GAAP TO NON-GAAP MEASURES
($ in millions; rounding differences may occur)
| Q1'24 | Q2'24 | Q3'24 | Q4'24 | Q1'25 | |||||||||||||||||||||||||
| Reconciliation of non-GAAP cost of revenue: | |||||||||||||||||||||||||||||
GAAP Cost of revenue | $ | 23.4 | $ | 22.7 | $ | 21.7 | $ | 22.9 | $ | 24.1 | |||||||||||||||||||
| % of Revenue | 22% | 22% | 21% | 22% | 23% | ||||||||||||||||||||||||
| Less: Stock-based compensation expense | 0.1 | 0.2 | 0.2 | 0.2 | 0.2 | ||||||||||||||||||||||||
| Less: Restructuring costs | 0.1 | — | — | — | — | ||||||||||||||||||||||||
| Non-GAAP Cost of revenue | $ | 23.2 | $ | 22.5 | $ | 21.5 | $ | 22.7 | $ | 23.8 | |||||||||||||||||||
| % of Revenue | 22% | 22% | 21% | 22% | 23% | ||||||||||||||||||||||||
| Reconciliation of non-GAAP gross profit and margin: | |||||||||||||||||||||||||||||
GAAP Gross profit | $ | 81.5 | $ | 81.7 | $ | 82.9 | $ | 80.3 | $ | 79.0 | |||||||||||||||||||
| Gross Margin | 78% | 78% | 79% | 78% | 77% | ||||||||||||||||||||||||
| Add back: Stock-based compensation expense | 0.1 | 0.2 | 0.2 | 0.2 | 0.2 | ||||||||||||||||||||||||
| Add back: Restructuring costs | 0.1 | — | — | — | — | ||||||||||||||||||||||||
| Non-GAAP Gross Profit | $ | 81.7 | $ | 81.9 | $ | 83.1 | $ | 80.4 | $ | 79.2 | |||||||||||||||||||
| Non-GAAP Gross Margin | 78% | 78% | 79% | 78% | 77% | ||||||||||||||||||||||||
| Reconciliation of non-GAAP operating expenses: | |||||||||||||||||||||||||||||
GAAP Research and development expense | $ | 28.1 | $ | 27.0 | $ | 26.6 | $ | 27.7 | $ | 31.2 | |||||||||||||||||||
| % of Revenue | 27% | 26% | 25% | 27% | 30% | ||||||||||||||||||||||||
| Less: Stock-based compensation expense | 3.8 | 3.9 | 2.8 | 3.2 | 3.3 | ||||||||||||||||||||||||
| Less: Restructuring costs | 0.1 | — | — | — | 0.2 | ||||||||||||||||||||||||
| Non-GAAP Research and development expense | $ | 24.2 | $ | 23.1 | $ | 23.8 | $ | 24.5 | $ | 27.6 | |||||||||||||||||||
| % of Revenue | 23% | 22% | 23% | 24% | 27% | ||||||||||||||||||||||||
GAAP Sales and marketing expense | $ | 32.3 | $ | 27.7 | $ | 28.8 | $ | 31.1 | $ | 33.4 | |||||||||||||||||||
| % of Revenue | 31% | 27% | 28% | 30% | 32% | ||||||||||||||||||||||||
| Less: Stock-based compensation expense | 1.8 | 0.8 | 1.5 | 1.8 | 2.3 | ||||||||||||||||||||||||
| Less: Restructuring costs | 1.1 | — | — | — | 0.7 | ||||||||||||||||||||||||
| Non-GAAP Sales and marketing expense | $ | 29.4 | $ | 26.9 | $ | 27.3 | $ | 29.3 | $ | 30.3 | |||||||||||||||||||
| % of Revenue | 28% | 26% | 26% | 28% | 29% | ||||||||||||||||||||||||
GAAP General and administrative expense | $ | 18.0 | $ | 19.1 | $ | 19.7 | $ | 19.8 | $ | 20.1 | |||||||||||||||||||
| % of Revenue | 17% | 18% | 19% | 19% | 20% | ||||||||||||||||||||||||
| Less: Stock-based compensation expense | 1.2 | 3.5 | 3.7 | 3.9 | 3.1 | ||||||||||||||||||||||||
| Less: Restructuring costs | 0.9 | — | — | — | 0.5 | ||||||||||||||||||||||||
| Non-GAAP General and administrative expense | $ | 16.0 | $ | 15.6 | $ | 15.9 | $ | 15.9 | $ | 16.5 | |||||||||||||||||||
| % of Revenue | 15% | 15% | 15% | 15% | 16% | ||||||||||||||||||||||||
18
RECONCILIATIONS OF GAAP TO NON-GAAP MEASURES
($ in millions; rounding differences may occur)
| Q1'24 | Q2'24 | Q3'24 | Q4'24 | Q1'25 | |||||||||||||||||||||||||
| Reconciliation of net earnings (loss) to Adjusted EBITDA: | |||||||||||||||||||||||||||||
| Net earnings (loss) | $ | 6.1 | $ | 10.1 | $ | 9.3 | $ | 1.5 | $ | (3.9) | |||||||||||||||||||
| Add back: | |||||||||||||||||||||||||||||
| Income tax provision | 0.3 | 1.2 | 1.7 | 3.5 | 0.4 | ||||||||||||||||||||||||
| Other income, net | (3.8) | (3.9) | (3.6) | (3.7) | (2.6) | ||||||||||||||||||||||||
| Operating income (loss) | 2.6 | 7.5 | 7.4 | 1.3 | (6.1) | ||||||||||||||||||||||||
| Operating Income (loss) Margin | 2% | 7% | 7% | 1% | (6)% | ||||||||||||||||||||||||
| Add back: | |||||||||||||||||||||||||||||
| Stock-based compensation expense | 7.0 | 8.4 | 8.3 | 9.1 | 9.0 | ||||||||||||||||||||||||
| Depreciation | 0.1 | 0.2 | 0.1 | — | — | ||||||||||||||||||||||||
| Amortization of intangibles | 0.3 | 0.3 | 0.3 | 0.3 | 0.3 | ||||||||||||||||||||||||
| Restructuring costs | 2.2 | — | — | — | 1.5 | ||||||||||||||||||||||||
| Adjusted EBITDA | $ | 12.2 | $ | 16.3 | $ | 16.1 | $ | 10.7 | $ | 4.8 | |||||||||||||||||||
| Adjusted EBITDA Margin | 12% | 16% | 15% | 10% | 5% | ||||||||||||||||||||||||
| Computation of Free Cash Flow: | |||||||||||||||||||||||||||||
| Net cash provided by (used in) operating activities | $ | 5.6 | $ | 19.7 | $ | 20.8 | $ | 10.8 | $ | (2.1) | |||||||||||||||||||
| Add: Restructuring costs | 1.4 | 0.6 | 0.2 | — | 0.9 | ||||||||||||||||||||||||
| Less: Capital expenditures | (0.2) | — | — | — | (0.1) | ||||||||||||||||||||||||
| Less: Internal-use software development costs | — | — | — | — | (2.0) | ||||||||||||||||||||||||
| Free Cash Flow | $ | 6.9 | $ | 20.3 | $ | 21.0 | $ | 10.8 | $ | (3.4) | |||||||||||||||||||
19
RECONCILIATION OF GAAP TO NON-GAAP FINANCIAL OUTLOOK
($ in millions; rounding differences may occur)
Twelve Months Ended December 31, 2025 | |||||
| Operating loss to Adjusted EBITDA: | |||||
| Operating loss | $ | (2.6) | |||
| Add back: | |||||
| Stock-based compensation expense | 28.5 | ||||
| Depreciation | 0.2 | ||||
| Amortization of intangibles | 1.4 | ||||
| Adjusted EBITDA | $ | 27.5 | |||
20
PRINCIPLES OF FINANCIAL REPORTING
We have provided in this press release certain non-GAAP financial measures, including Adjusted EBITDA, non-GAAP gross profit, non-GAAP operating expenses, and free cash flow, to supplement our financial information presented in accordance with GAAP. We use these non-GAAP financial measures internally in analyzing our financial results and believe that they are useful to investors as an additional tool to evaluate ongoing operating results and trends and in comparing our financial results with other companies in our industry, many of which present similar non-GAAP financial measures. However, our presentation of these non-GAAP financial measures may differ from the presentation of similarly titled measures by other companies. Adjusted EBITDA is one of the metrics on which our internal budgets are based and also one of the metrics by which management is compensated. We believe that investors should have access to, and we are obligated to provide, the same set of tools that we use in analyzing our results. These non-GAAP financial measures should be considered in addition to results prepared in accordance with GAAP, but should not be considered a substitute for or superior to GAAP results. We endeavor to compensate for the limitations of the non-GAAP measures presented by providing the comparable GAAP measure with equal or greater prominence and descriptions of the reconciling items, including quantifying such items, to derive the non-GAAP measure. We encourage investors to examine the reconciling adjustments between the GAAP and corresponding non-GAAP measure.
From time to time, we provide forward-looking outlook information, including for Adjusted EBITDA. Adjusted EBITDA used in our outlook will differ from net (loss) earnings and operating (loss) income in ways similar to the reconciliations provided above and the definitions of Adjusted EBITDA provided below.
Definitions of Non-GAAP Measures
Adjusted Earnings Before Interest, Taxes, Depreciation and Amortization ("Adjusted EBITDA") is defined as operating (loss) income excluding: (1) stock-based compensation expense; (2) depreciation; (3) amortization of intangible assets; (4) gains and losses recognized on changes in the fair value of contingent consideration arrangements; and (5) restructuring costs associated with exit or disposal activities such as a reduction in force or reorganization. We believe this measure is useful for analysts and investors as this measure allows a more meaningful comparison between our performance and that of our competitors. The above items are excluded from our Adjusted EBITDA measure because these items are either non-cash or non-recurring in nature and are collectively referred to as "Adjusted EBITDA Non-GAAP Adjustments." Adjusted EBITDA has certain limitations because it excludes the impact of these expenses.
Adjusted EBITDA Margin is Adjusted EBITDA, divided by revenue.
Non-GAAP Cost of Revenue excludes stock-based compensation expense and restructuring costs.
Non-GAAP Gross Profit excludes stock-based compensation expense and restructuring costs included in Cost of revenue.
Non-GAAP Gross Margin is Non-GAAP Gross Profit, divided by revenue.
Non-GAAP Operating Expenses include Non-GAAP Research and development expense, Non-GAAP Sales and marketing expense, and Non-GAAP General and administrative expense. These Non-GAAP operating expenses exclude Adjusted EBITDA Non-GAAP Adjustments in their respective expense items.
Free Cash Flow is defined as net cash provided by, or used in, operating activities excluding restructuring costs and contingent consideration payments included in operating activities, less cash used for capitalized software development costs and capital expenditures. We believe Free Cash Flow is useful to investors as a liquidity measure because it measures our ability to generate or use cash.
Items That Are Excluded From Non-GAAP Measures
Stock-based compensation expense consists of expense associated with the grants of Vimeo stock-based awards. These expenses are not paid in cash and we view the economic costs of stock-based awards to be the dilution to our share base. We also consider the dilutive impact of stock-based awards in GAAP diluted (loss) earnings per share, to the extent such impact is dilutive.
Depreciation is a non-cash expense relating to our leasehold improvements and equipment and is computed using the straight-line method to allocate the cost of depreciable assets to operations over their estimated useful lives, or, in the case of leasehold improvements, the lease term, if shorter.
Amortization of intangible assets are non-cash expenses related to capitalized internal-use software development costs or acquisitions. Amortization of capitalized internal-use software development costs is computed using the straight-line method to allocate
21
the cost of such assets to operations over their estimated useful lives. At the time of an acquisition, the identifiable definite-lived intangible assets of the acquired company are valued and amortized over their estimated useful lives. We believe that acquired intangible assets represent costs incurred by the acquired company to build value prior to acquisition and the related amortization is not an ongoing cost of doing business.
Gains and losses recognized on changes in the fair value of contingent consideration arrangements are accounting adjustments to report contingent consideration liabilities at fair value. These adjustments can be highly variable and are excluded from our assessment of performance because they are considered non-operational in nature and, therefore, are not indicative of current or future performance or the ongoing cost of doing business.
Restructuring costs consist of costs associated with exit or disposal activities such as severance and other post-employment benefits paid in connection with a reduction-in-force or reorganization. We consider these costs to be non-recurring in nature and therefore, are not indicative of current or future performance or the ongoing cost of doing business.
Operating Metrics and Key Terms
Self-Serve relates to our subscription plans sold directly online.
Vimeo Enterprise relates to our video offering designed for teams and organizations, which includes the same capabilities of Self-Serve plus enterprise-grade features such as advanced security, custom user permissions, single-sign on for employees, interactive video tools, and marketing software integrations. Vimeo Enterprise is sold through our sales force and is often an upgrade from Vimeo's Self-Serve as the number of users or use cases in an organization grows.
OTT relates to our over-the-top ("OTT") video monetization solution that allows customers to launch and run their own video streaming channel directly to their audience through a branded web portal, mobile apps, and Internet-enabled TV apps. Revenue and operating metrics derived from OTT had previously been included in Other.
Add-Ons relates to add-on services tied to our online subscriptions such as bandwidth charges, which are sold through our sales force to subscribers of one of our plans if they exceed a certain threshold of bandwidth. Revenue derived from Add-Ons had previously been included in Self-Serve & Add-Ons.
Other primarily includes Magisto and Livestream.
Subscribers is the number of users who have an active subscription to one of Vimeo's paid plans measured at the end of the relevant period. Vimeo counts each customer with a subscription plan as a subscriber regardless of the number of users. In the case of customers who maintain subscriptions across Self-Serve, Vimeo Enterprise, and OTT, Vimeo counts one subscriber for each of the components in which they maintain one or more subscriptions. Vimeo does not count users or team members who have access to a subscriber's account as additional subscribers.
Average Subscribers is the sum of the number of Subscribers at the beginning and at the end of the relevant measurement period divided by two.
Average Revenue per User ("ARPU") is the annualized revenue for the relevant period divided by Average Subscribers. For periods that are less than a full year, annualized revenue is calculated by dividing the revenue for that particular period by the number of calendar days in the period and multiplying this value by the number of calendar days in that year.
Bookings consist of fixed fees for software-as-a-service (“SaaS”) services, measured at the end of the relevant period, that subscribers have committed to pay during their subscription period, which is generally 12 months, less refunds and chargebacks during the same period.
Gross Margin is revenue less cost of revenue, divided by revenue.
Operating (Loss) Income Margin is Operating (loss) income, divided by revenue.
22
DILUTIVE SECURITIES
Vimeo has various dilutive securities. The table below details these securities as well as estimated dilution at various stock prices (shares in millions; rounding differences may occur).
| Shares | Avg. Exercise Price | As of 5/1/2025 | Dilution at: | ||||||||||||||||||||||||||
| Share Price | $ | 5.09 | $ | 6.00 | $ | 8.00 | $ | 10.00 | $ | 12.00 | |||||||||||||||||||
| Common Stock Outstanding as of 5/1/2025 | 164.7 | 164.7 | 164.7 | 164.7 | 164.7 | 164.7 | |||||||||||||||||||||||
| SARs and Stock Options | 6.3 | $ | 5.42 | — | — | 0.8 | 1.4 | 1.8 | |||||||||||||||||||||
| RSUs | 12.0 | 6.5 | 6.5 | 6.5 | 6.5 | 6.5 | |||||||||||||||||||||||
| Total Estimated Dilution | 6.5 | 6.5 | 7.3 | 7.9 | 8.3 | ||||||||||||||||||||||||
| % Dilution | 3.9 | % | 3.9 | % | 4.4 | % | 4.8 | % | 5.0 | % | |||||||||||||||||||
| Total Estimated Diluted Shares Outstanding | 171.2 | 171.2 | 172.1 | 172.6 | 173.0 | ||||||||||||||||||||||||
The dilutive securities presentation is calculated using the methods and assumptions described below, which are different than those prescribed by GAAP.
The estimated dilutive effect was calculated assuming the Company settles equity awards on a net basis; therefore, the dilutive effect is presented as the net number of shares expected to be issued upon vesting or exercise, adjusted for (i) the estimated income tax benefit from the tax deduction received upon the vesting or exercise of awards held in the U.S., as such tax benefit is assumed to be used to repurchase shares of Vimeo common stock and (ii) in the case of stock options, the strike price proceeds that are received by the Company and assumed to be used to repurchase shares of Vimeo common stock. The number of shares required to settle stock appreciation rights will be impacted by movement in the stock price of Vimeo.
23
OTHER INFORMATION
Cautionary Statement Regarding Forward-Looking Information
This press release and the Vimeo livestream which will be held at 5 p.m. Eastern Time on May 5, 2025, contain "forward-looking statements" within the meaning of the Private Securities Litigation Reform Act of 1995. Words such as "will," "may," "could," "should," "would," "anticipates," "estimates," "expects," "plans," "projects," "forecasts," "intends," "targets," "seeks" and "believes," as well as variations of these words or comparable words, among others, generally identify forward-looking statements. These forward-looking statements include, among others, statements relating to Vimeo's expectations regarding future results of operations and financial condition, business strategy, and plans and objectives of management for future operations, including our plans with respect to our share repurchase authorization. Forward-looking statements are based on our management’s beliefs and assumptions and on information currently available. These forward-looking statements are subject to a number of known and unknown risks, uncertainties and assumptions. Actual results could differ materially from those contained in or implied by these forward-looking statements. Factors that could cause or contribute to such differences include, but are not limited to: adverse changes in economic conditions, changes in the regulatory landscape, including, in particular, changes in laws that might increase the liability of online intermediaries for user-generated content and developments in AI laws, reputational damage caused by problematic user content or our decisions to remove (or not remove) it; changes in policies implemented by third party platforms upon which we rely for traffic and distribution of mobile apps, increased competition in the online video category, our ability to convert visitors into uploaders and uploaders into paying subscribers, our ability to retain paying subscribers by maintaining and improving our value proposition, our ability to provide video storage and streaming in a cost-effective manner, our ability to successfully attract customers through our sales force, our ability to protect sensitive data from unauthorized access, the integrity, quality, scalability and redundancy of our systems, technology and infrastructure (and those of third parties with which we do business), our ability to repurchase shares of the Company's common stock according to our announced intent or at all, subject to risks such as adverse developments or changes in market conditions or fluctuations in the trading volume and market price of our common stock, our ability to successfully operate in and expand into additional international markets, our ability to adequately protect our intellectual property rights and not infringe the intellectual property rights of third parties, foreign exchange currency rate fluctuations, the impact of geopolitical events on our business, the possibility that our historical consolidated and combined results may not be indicative of our future results and the other factors set forth in the section titled "Risk Factors" in our Annual Report on Form 10-K for the fiscal year ended December 31, 2024 filed with the Securities and Exchange Commission ("SEC") on February 19, 2025, as they may be updated by our periodic reports subsequently filed with the SEC, including our Quarterly Report on Form 10-Q to be filed with the SEC on May 5, 2025. Other unknown or unpredictable factors that could also adversely affect Vimeo’s business, financial condition and results of operations may arise from time to time. In light of these risks and uncertainties, these forward-looking statements may not prove to be accurate. Accordingly, you should not place undue reliance on these forward-looking statements, which only reflect the views of Vimeo’s management as of the date of this communication. Vimeo does not undertake to update these forward-looking statements.
About Vimeo
Vimeo (NASDAQ: VMEO) is the world's most innovative video experience platform. We enable anyone to create high-quality video experiences to better connect and bring ideas to life. We proudly serve our community of millions of users – from creative storytellers to globally distributed teams at the world's largest companies – whose videos receive billions of views each month. Learn more at www.vimeo.com.
Contact Us
Vimeo Investor Relations
ir@vimeo.com
Vimeo Communications
Ronda Morra
press@vimeo.com
24